Visualization
The ai4materials Viewer combines Bokeh (interactive visualization of large dataset) and jsmol (3D visualization of chemical structures) to allow the interactive exploration of materials science datasets. Users can visualize crystal structures and properties of - a possibly large number of - materials in one webpage, interactively.
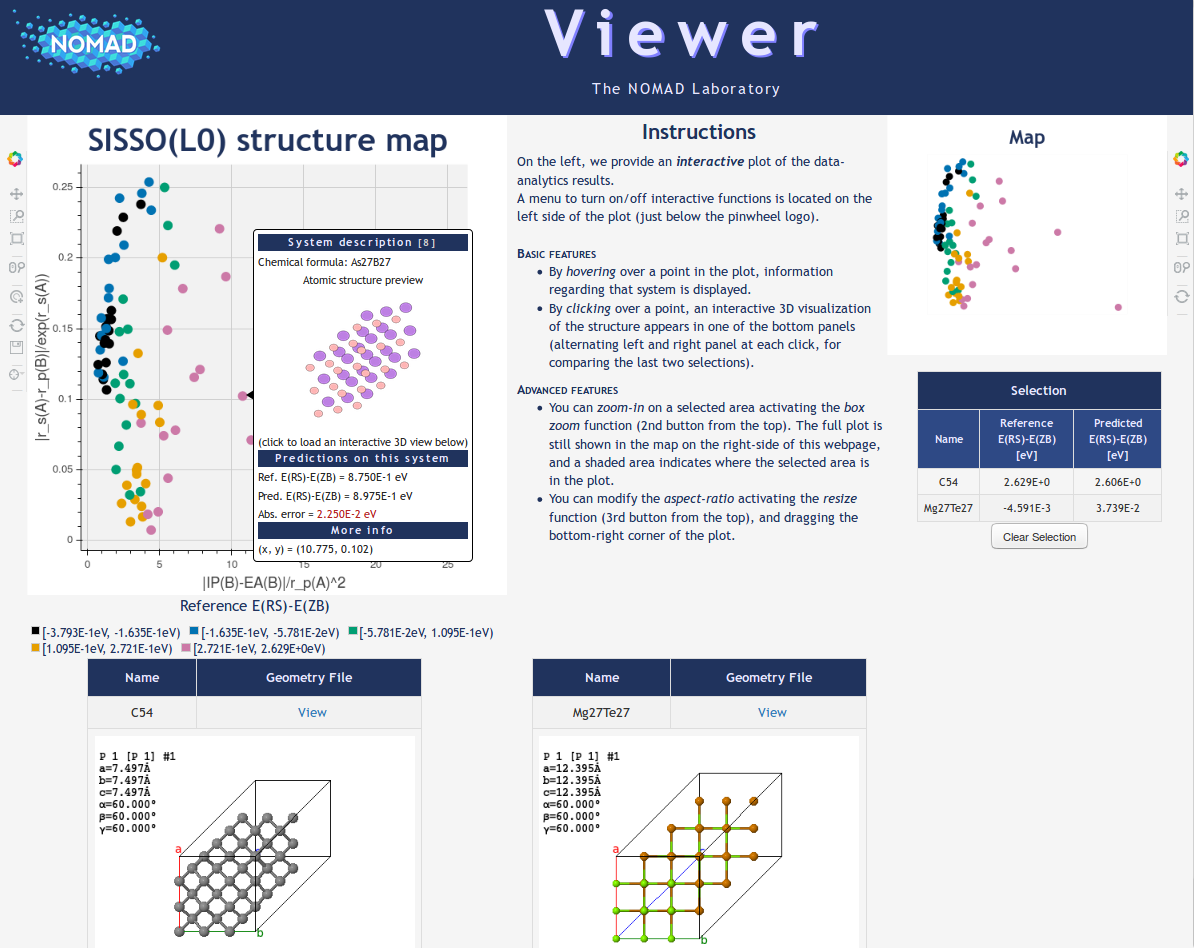
Below we present an example of how to create an interactive Viewer using ai4materials. The code below allows to generate an interactive plot of the results of Ref. [1], in particular Fig. 2 in the article.
from ai4materials.visualization.viewer import Viewer
from ai4materials.utils.utils_config import set_configs
from ai4materials.utils.utils_data_retrieval import read_ase_db
from ai4materials.visualization.viewer import read_control_file
from ai4materials.utils.utils_config import get_data_filename
import pandas as pd
import webbrowser

# read data: crystal structures, information on the plot, name of the axis
ase_db_file_binaries = get_data_filename('data/db_ase/binaries_lowest_energy_ghiringhelli2015.json')
results_binaries_lasso = get_data_filename('data/viewer_files/l1_l0_dim2_for_viewer.csv')
control_file_binaries = get_data_filename('data/viewer_files/binaries_control.json')

configs = set_configs()

ase_atoms_binaries = read_ase_db(db_path=ase_db_file_binaries)

# from the table, extract the coordinates for the plot, the true and the predicted value
df_viewer = pd.read_csv(results_binaries_lasso)
x = df_viewer['coord_0']
y = df_viewer['coord_1']
target = df_viewer['y_true']
target_pred = df_viewer['y_pred']

# define titles in the plot
legend_title = 'Reference E(RS)-E(ZB)'
target_name = 'E(RS)-E(ZB)'
plot_title = 'SISSO(L0) structure map'

# create an instance if the ai4materials Viewer
viewer = Viewer(configs=configs)

# read x and y axis labels from control file
x_axis_label, y_axis_label = read_control_file(control_file_binaries)

# generate interactive plot
file_html_link, file_html_name = viewer.plot_with_structures(x=x, y=y, target=target, target_pred=target_pred,
                                                             ase_atoms_list=ase_atoms_binaries, target_unit='eV',
                                                             target_name=target_name, legend_title=legend_title,
                                                             is_classification=False, x_axis_label=x_axis_label,
                                                             y_axis_label=y_axis_label, plot_title=plot_title,
                                                             tmp_folder=configs['io']['tmp_folder'])

# open the interactive plot in a web browser
webbrowser.open(file_html_name)
This is a screenshot of the interactive ai4materials Viewer generated with the code above:
Implementation details of the ai4materials Viewer can be found at ai4materials.visualization.viewer.
In some systems, Google Chrome will not correctly to load jmol, so you will be able to load the interactive plot,
but not to explore crystal structures in 3D.
To exploit all functionalities of the ai4materials Viewer, we recommend to use Firefox; in particular, the Viewer
was tested on Firefox Quantum 61.0.1.
| [1] | L. M. Ghiringhelli, J. Vybiral, S. V. Levchenko, C. Draxl, and M. Scheffler, “Big Data of Materials Science: Critical Role of the Descriptor,” Physical Review Letters, vol. 114, no. 10, p. 105503 . [Link to article] |
Section author: Angelo Ziletti <angelo.ziletti@gmail.com>